Liver
Wilson's Disease
Optimized bioassays for the preclinical screening of small molecules, siRNA and oligo therapeutic candidates and base editing approaches
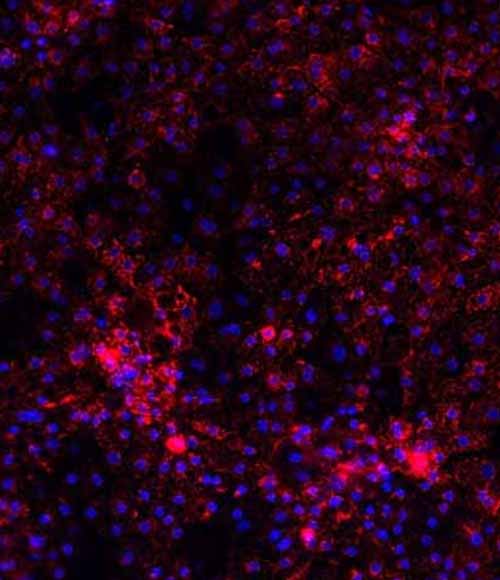
Wilson's disease drug screening platform
DefiniGEN have created Wilson’s disease model hepatocytes for the evaluation of therapeutic candidates. Wilson’s disease is an autosomal-recessive disorder of the copper-transporting gene ATP7B, causing copper deposition and toxicity in the liver, brain, eyes and other organs. Using our in-house iPSC line we generated clones containing several pathogenic mutations of the ATP7B gene including p.H1069Q and p.R778L via CRISPR gene-editing, differentiated to hepatocytes using our Ulti-DIFF process and then characterized using high content imaging and fluorescent assays.
Disease modelled hepatocytes were shown to have increased toxicity and oxidative stress resulting from copper challenge when compared to wild-type cells which could be rescued in a dose-dependent manner using the copper-chelator Trientine or a number of function-restoring mRNA therapies.
These data confirm both sensitivity and specificity of response to environmental challenge and rescue treatments, thereby demonstrating that this disease model is highly applicable to candidate drug screening in Wilson’s disease.
1) Characterization
DefiniGEN have created Wilson’s disease model hepatocyte for the evaluation of therapeutic candidates.

Figure 1. Sanger sequencing analysis showing the presence of a homozygous c.2333G>T (CGG>CTG; R778L) mutation in exon 8 of ATP7B gene in WD R778L iPSC model (top) and a homozygous c.3207C>A (CAC>CAA; H1069Q) mutation in exon 14 of ATP7B gene in the WD H1069Q iPSC model (bottom). The rectangles indicate the missense pathogenic mutations.

Figure 2 A). Representative images of ATP7B R778L and ATP7B H1069Q HEPs showing a typical cobblestone morphology. B) Gene expression analysis of key hepatic markers: ALB and A1AT, showing efficient hepatic differentiation ability of WD-introduced iPSCs. PHH cDNA used as the positive control of full hepatic maturation.
2) Phenotypic Validation
Wilson’s Disease (WD) can be modelled measuring oxidative stress as an endpoint in HLCs.
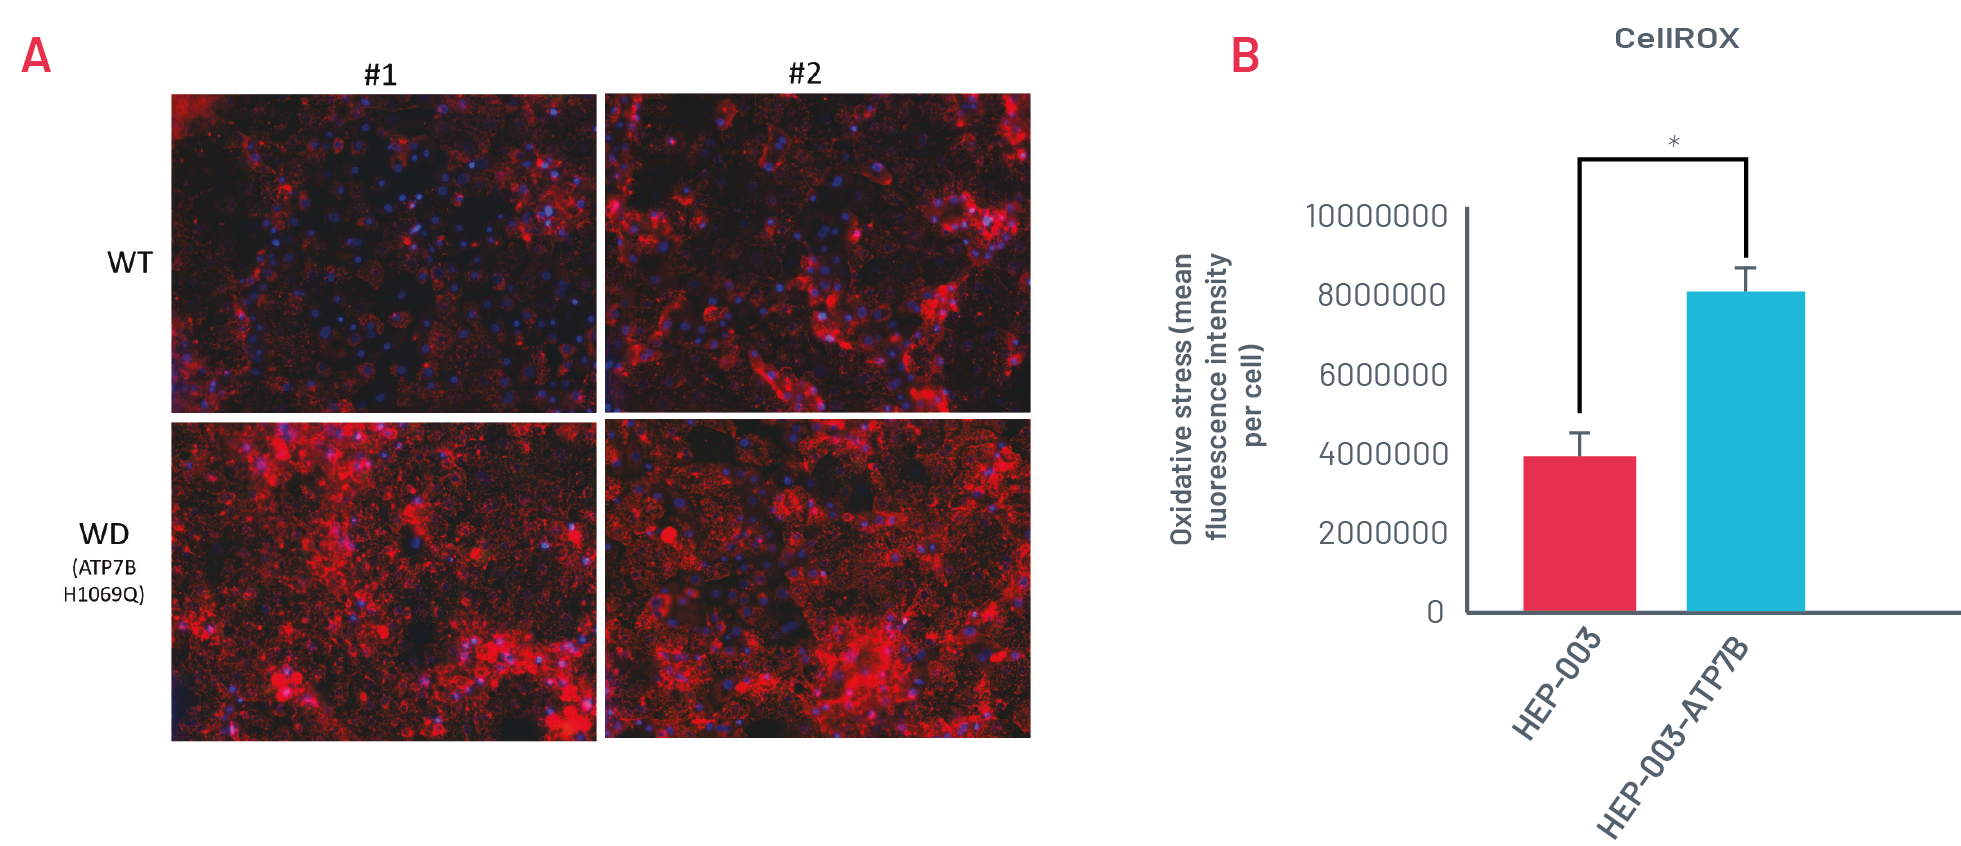
Figure 3. A) Staining with CellROX Orange in wild-type (HEP-003) and H1069Q Wilson’s Disease (WD) HLCs (HEP-003-ATP7B-H1069Q) when challenged with 250μM CuCl2 for 24h. Representative images of n=3 independent experiments. B) Quantification of CellROX Orange staining in wild-type and H1069Q WD HLCs (n=3 independent experiments). * p<0.05
WD HLCs show oxidative stress consistently upon being challenged with CuCl2
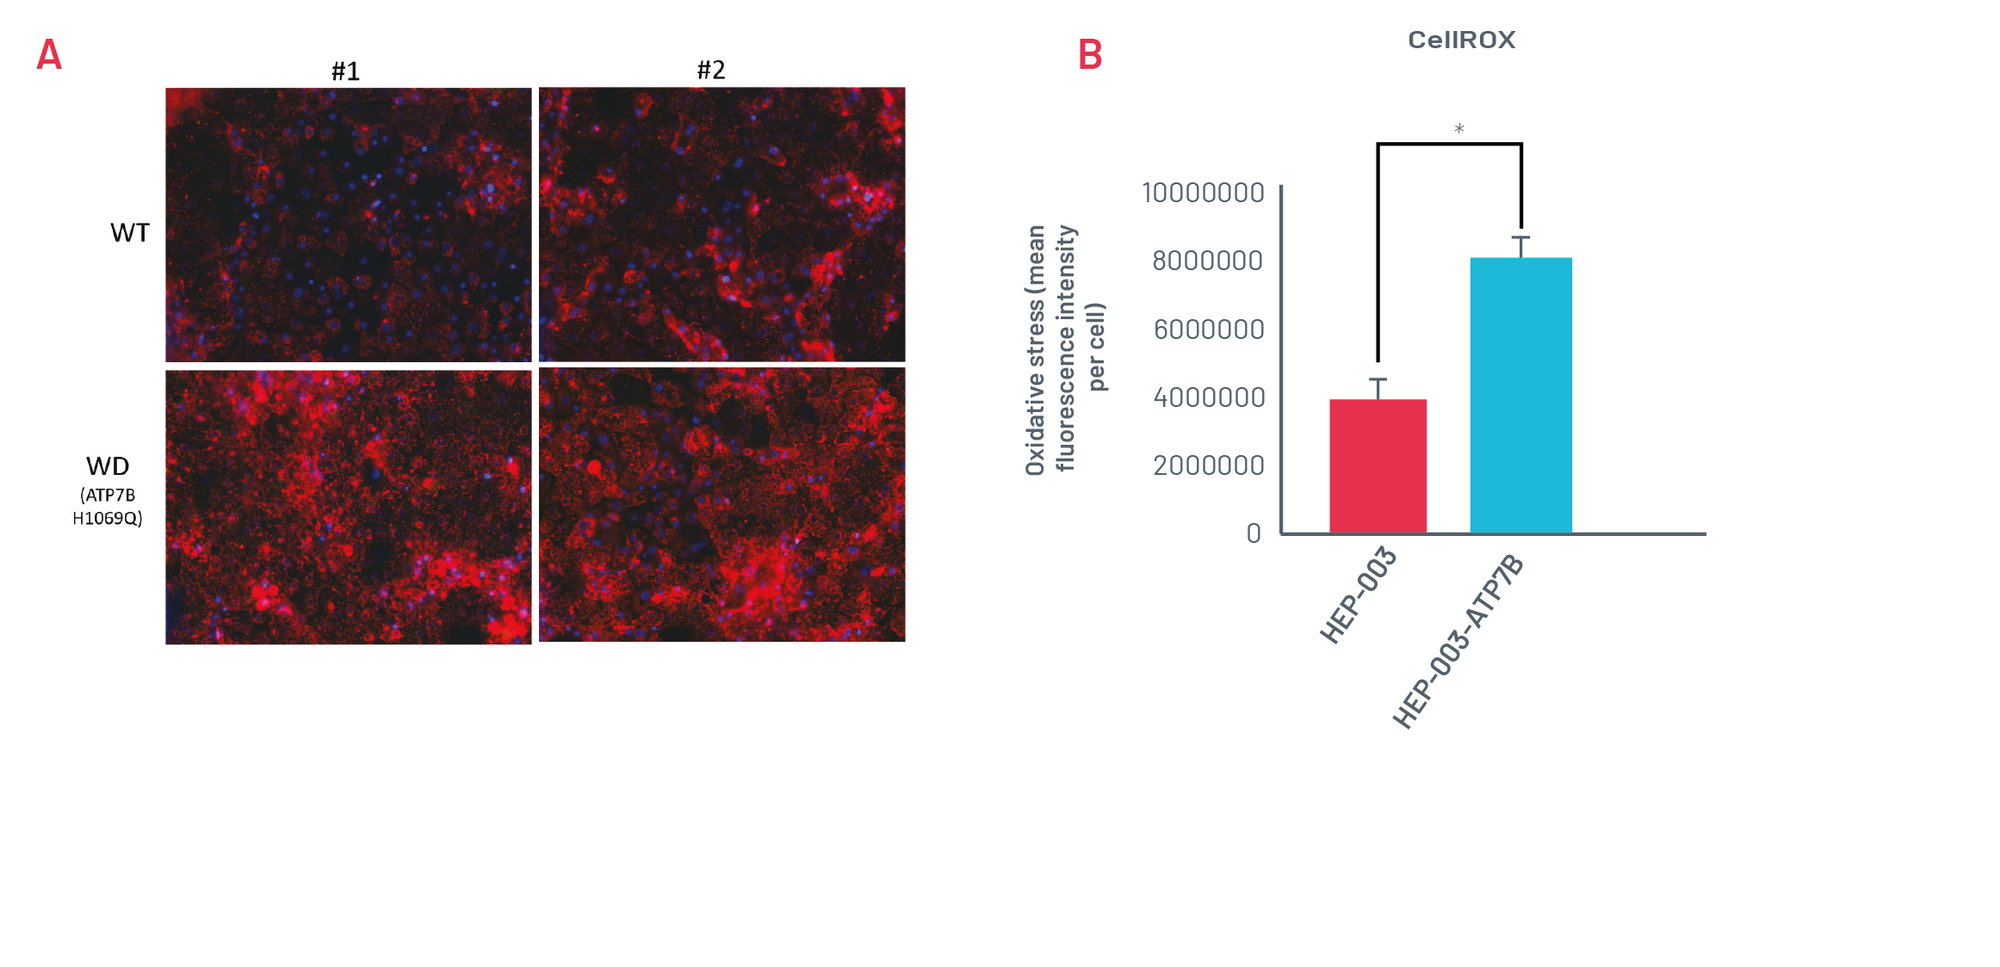
Figure 4. A) Staining with CellROX Orange shows the levels of oxidative stress in WD H1069Q HLCs HLCs across the central wells of a 96 well plate when treated with CuCl2 for 24h. Representative images of 3 independent experiments. B) Quantification of the CellROX Orange staining across the central wells of a 96 well plate. Values normalized to average of the plate set as 1 (n=3).
WD HLCs respond to reference chelator Trientine Hydrochloride

Figure 5. A) CellROX Orange staining showing levels of oxidative stress in H1069Q WD HLCs treated with Trientine Hydrochloride in a dose-dependent manner. B) Quantification of the oxidative stress showing normalised MFI per cell. Results are normalized to vehicle-treated cells set as 100% presented as mean±SEM of n=3 biological replicates C) Heatmap showing quantification of oxidative stress upon treatment with decreasing concentrations of Trientine Hydrochloride.
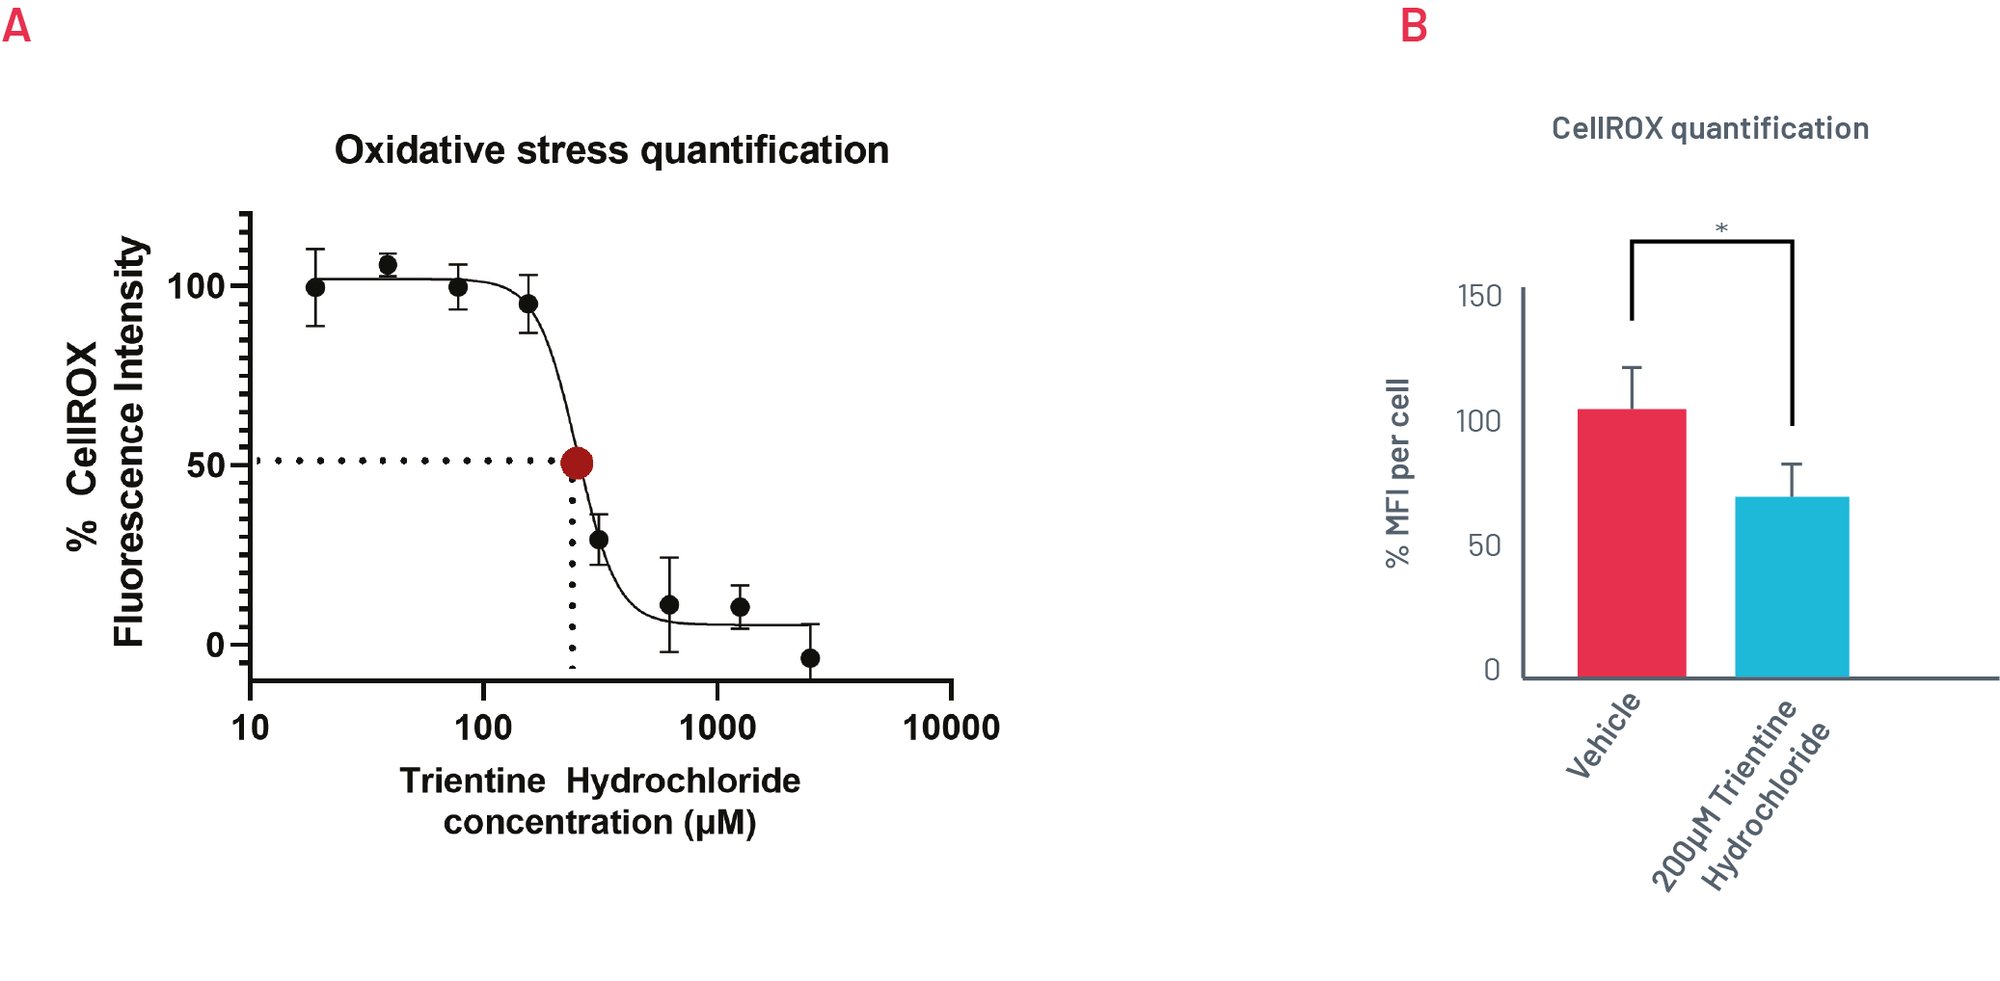
Figure 6. A) Quantification of oxidative stress levels in H1069Q WD HLCs upon treatment with increasing concentrations of Trientine Hydrochloride show an EC50 close to 200µM (n=3). B) H1069Q WD HLCs oxidative stress response to treatment with 200µM of Trientine Hydrochloride. Results expressed as mean±SEM of n=3 biological replicates. *p<0.05
Phenotype of H1069Q WD HLCs can be recovered with WT ATP7B mRNA
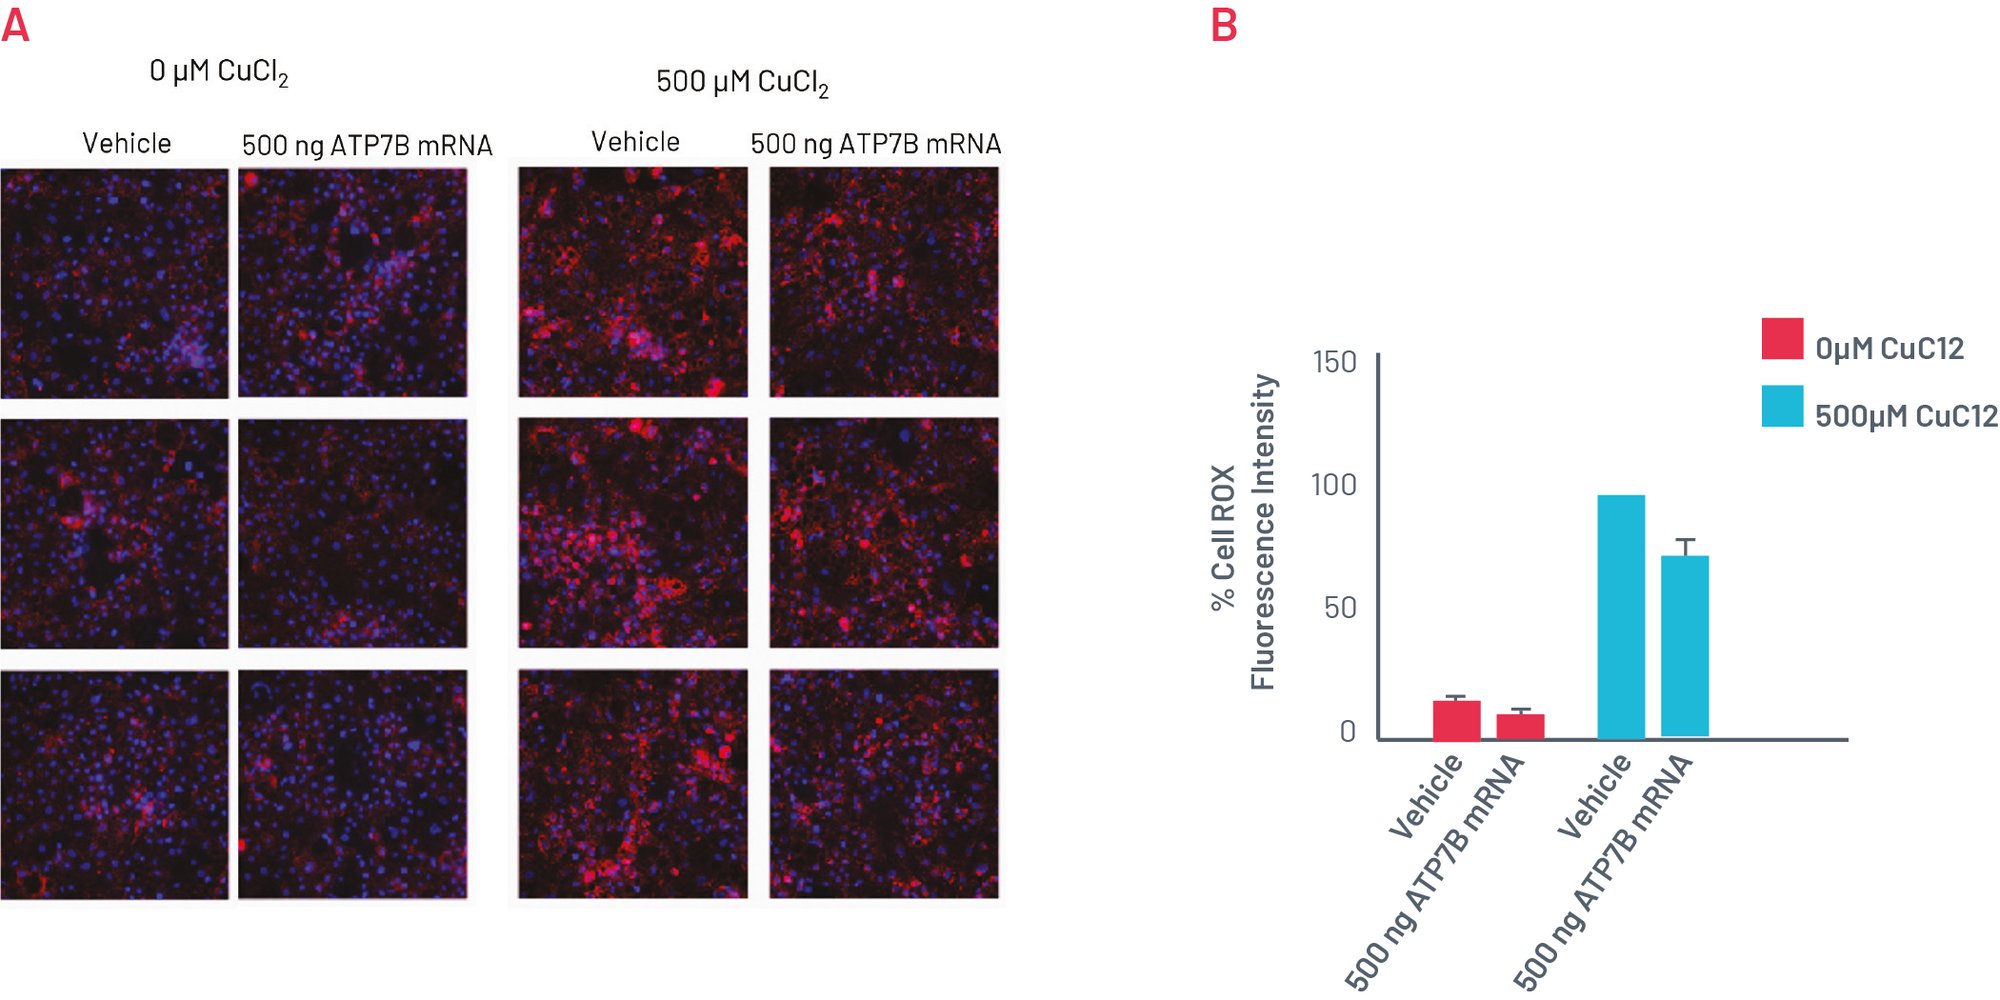
Figure 7. A) CellROX Orange staining showing levels of oxidative stress in in H1069Q WD HLCs upon transfection with WT ATP7B mRNA for 96h. B) Quantification of the oxidative stress showing normalised MFI per cell. Results normalised to 500µM CuCl2 + vehicle set as 100% and expressed as mean±SEM of n=3 biological replicates
Frequently asked questions
How long is the turnaround time for a CRISPR project?
It depends on the complexity of the project but generally we deliver the edited cell line in 8 weeks. If differentiation into a specific cell type is required, additional time will be necessary and will depend on the requested scale and cell type of interest.
How long does the entire gene editing process take?
The entire gene editing process takes between 8-10 weeks depending on the complexity of the project. We will advise you of the lead time when we generate your quote.
What do you provide as a technical support package?
We work as a research partner offering collaborative services. We offer bi-weekly calls with our clients and interim emails with project reports. Our team is always available to provide technical support which can include experimental design and training on best practices for handling cells.


